Reaktor DevTools
DevTools is the workbench pane that shows what a running app is doing on real phones. It mirrors each phone live, side by side, and lets you inspect the app, drive it from the desktop, scroll back through what the screen showed, and score it the way Lighthouse scores a web page.
Status: rebuilt end to end and checked on a Samsung Galaxy S23 (Android 16) and an iPhone 14 Pro (iOS 26.5) on 30 September 2026. Sections 1–5 describe what ships. Section 6 compares it with the tools it learns from, section 7 is the roadmap, and section 8 keeps the design direction the earlier version of this page set out.
At a glance
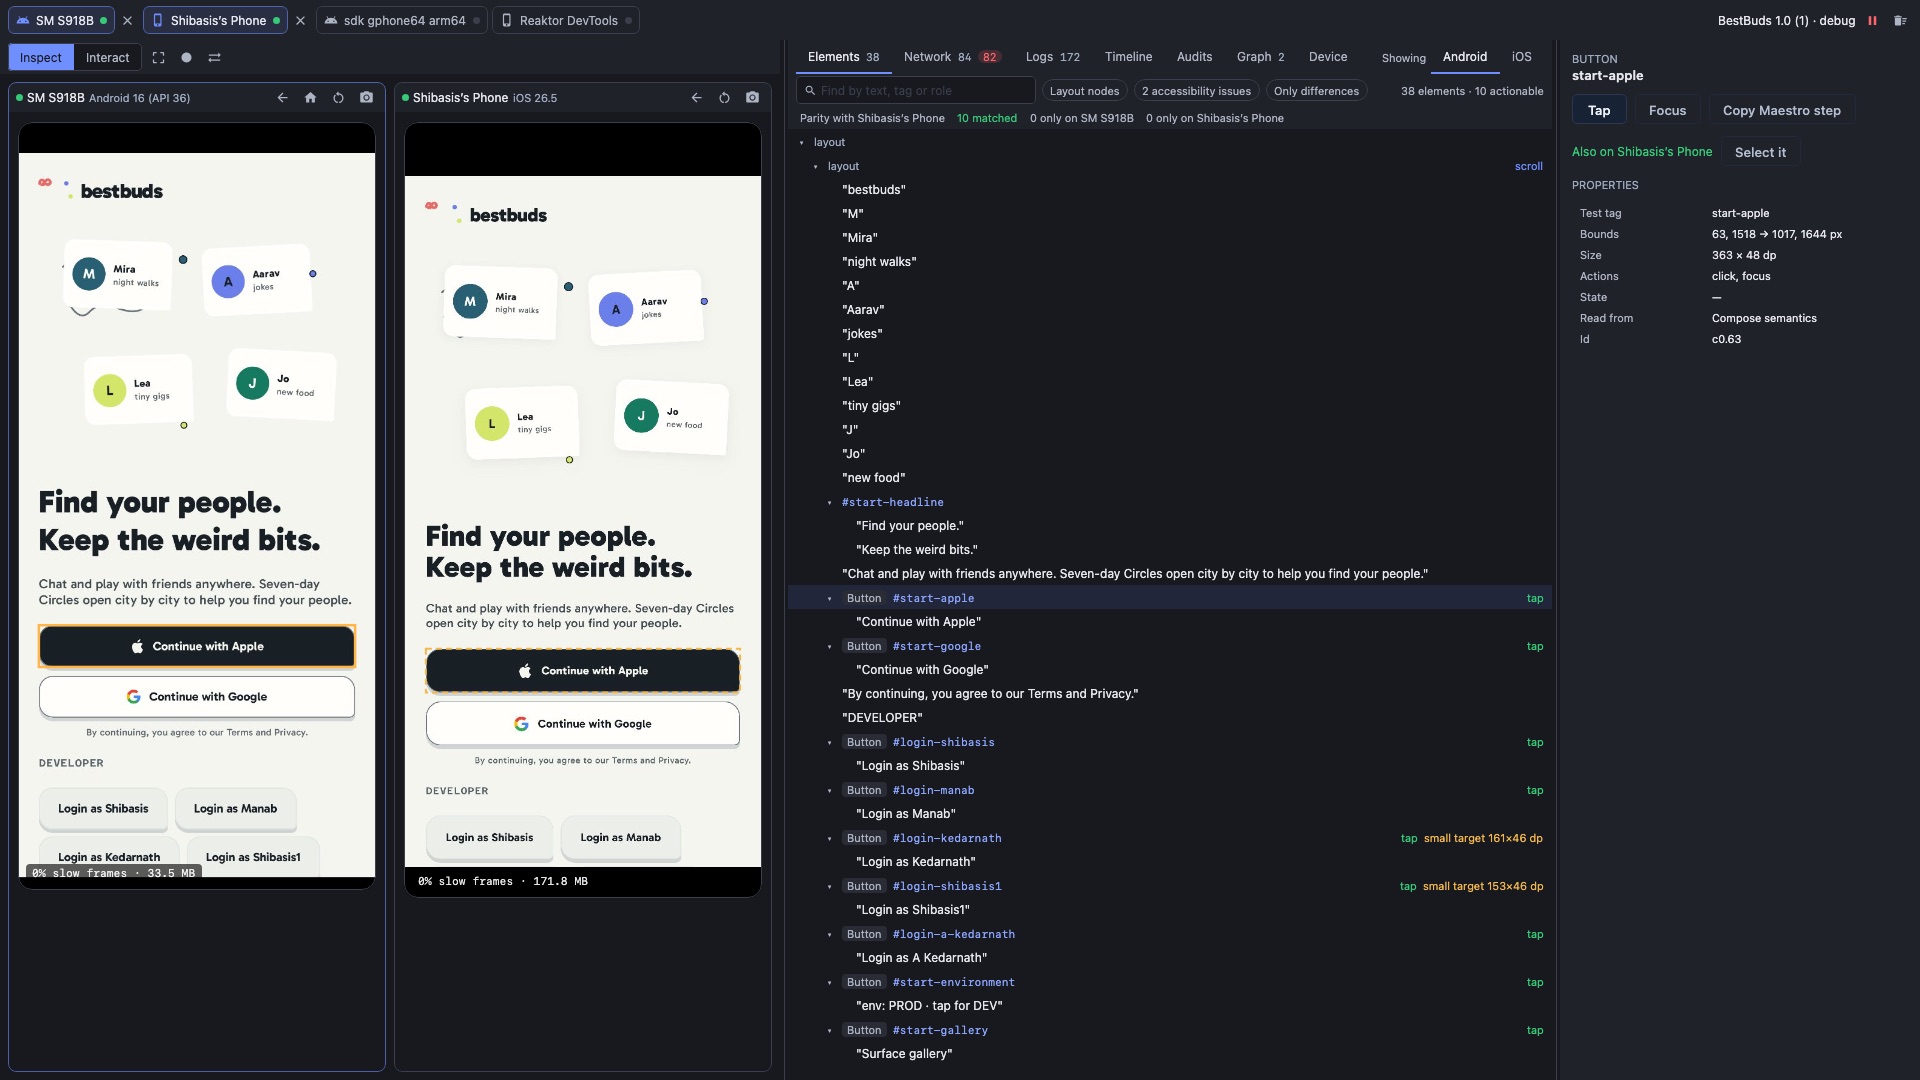
- Screens. Each phone is mirrored live. Inspect mode picks elements; Interact mode taps, drags, scrolls and types into the real app.
- Elements. The app's real UI tree from each phone, matched across the two phones, with accessibility checks.
- Network. Every HTTP call with headers, bodies and timing, and every WebSocket connection with its messages. Filter with a query language, export HAR, slow the app's network down, take it offline, or block a request.
- Logs. App logs, plus the system log on Android, with the same query language.
- Timeline. Frames, network, graph ports, logs and memory on one clock, with a filmstrip of the screen. Click or drag the filmstrip and the phone mirror shows that moment again.
- Audits. Live scores for performance, network, accessibility, stability and parity between the phones, each finding linked to the request, log line or element behind it.
- Graph. Call counts, failures and latency per port of the app's dataflow graph.
- Device. Launch, stop and restart the app, launch time, deep links, display settings, network conditions, the app's own commands, and crashes.
- Saved sessions. Save what the pane captured from a phone to a
.reaktortracefile, open it later without the phone, and compare it side by side with a live phone. - Coding agents. Seven read-only MCP tools give an agent the same devices, audits, requests, logs, elements and sockets.
Operations and Shadow integration
DevTools belongs to Operations & Reliability. Its live-device frame, memory, startup, traffic and port observations complement Crashlytics and Reaktor client evidence and instance diagnosis. The Measure tab, SDK wrappers, dashboard client, interceptor and local launcher are removed. Reaktor application-session IDs carry client identity. Hangar Telemetry has separate kernel-owned backend span and Crashlytics report reads; neither needs an attached phone. Provider readback and exact graph attribution remain qualification work.
DevTools is gated to debug builds. Current BestBuds debug capture includes request/response bodies and WebSocket text with pattern masking; this is development-only evidence, not a production privacy guarantee. Release qualification must prove debug DevTools capture is absent and the resolved mobile artifacts contain no Measure SDK. Crashlytics and ordinary Reaktor client evidence contain no payload bodies. Any future payload journal follows Shadow privacy and effect safety.
For deeper CPU/heap/native diagnosis use Profiling. Recorded interactions become Shadow inputs only with pinned client/backend state, artifact identity, approved effects and fixed assertions; a screen timeline or network transcript alone does not reconstruct a complete execution. Client verification owns that contract. Keep measured instance footprint distinct from app download/installed size and confirmed retained-object leaks.
1. How it works
Three independent paths feed the workbench:
- Live device inspection: a debug app embeds Reaktor's
DevToolsAgent. Screens, semantics, logs, network observations, vitals and graph facts travel over the device connection to Hangar. This powers the core DevTools panes. - Backend service evidence: a bounded ClickHouse read runs through the kernel execution ledger.
KernelTelemetryNodesupplies the same environment-scoped retained receipt to Hangar's backend Spans view, system overlay and read-onlytelemetry_spansMCP tool. Missing session/build/node/digest columns, unresolved parents, stale receipts and limits remain explicit. Overlay placement by service contract is inferred; exact revision-qualified graph attribution remains unfinished. - Mobile crash reports:
KernelCrashesNodecalls the existing Firebase provider through the trusted workspace door. Hangar's Crashes pane andtelemetry_crashesread its retained report and provenance. The initial report covers up to 50 issues over seven days, with separate Android/iOS reads. Firebase app registrations currently combine dev and production, so reports are partial evidence. CLI sign-in and provider readback remain required.
Measure previously supplied an additional SDK and dashboard tab. It did not power the core device transport or DevTools agent.
The app carries a small agent, reaktor-devtools, that streams what it sees and accepts commands.
The desktop reaches it over one socket per phone:
Android   app agent ── localabstract:reaktor-devtools ── adb forward ─────────┐
iOS       app agent ── loopback port 47821 ─────────── idb_companion --forward ┤── DevTools pane
                                                                               ┘   (engine · devices)
The agent is only in debug builds that ask for it. BestBuds turns it on with the Gradle property
bestbuds.devTools=true. An agent serves one connection at a time, so the pane only connects to
the phones you have chosen; a phone another tool is using is left alone.
What the agent sends, and where each part comes from on each platform:
| Capability | What it carries | Android | iOS |
|---|---|---|---|
screen | JPEG frames (up to 1280 px, up to 8 per second) with the whole UI tree taken at the same moment | a graphics layer over the app root, and Compose's semantics tree | the same layer, and the UIKit accessibility tree that Compose Multiplatform builds |
traffic | HTTP calls with headers, bodies up to 64 KiB and timing; WebSocket connections, their messages (text up to 16 KiB) and how they closed; secrets are masked | a plugin in reaktor-io's Ktor client, and a hook in its WebSocket client | the same |
logs | the app's logs; on Android also the system log for the app's process | agent log sink, logcat over adb | agent log sink |
port.events | calls crossing the app's graph ports, with duration and failures | graph taps | graph taps |
graph.shape | the app's whole graph (scopes, nodes, ports, wires, routes, back stacks), sent again when navigation changes it; read by the Graph pane | Graph.shapes() | Graph.shapes() |
port.watch | on request, the result of each call through a watched port, summarised and masked; only on builds that capture values | graph taps | graph taps |
vitals.frame | each frame's duration against the display's own frame interval | Choreographer | CADisplayLink |
vitals.memory | memory in use, sampled | runtime | task info |
vitals.startup | time from process start to the first drawn frame | Process.getStartUptimeMillis() | process start time from sysctl |
crash | crashes, kept on disk and sent on the next connection | crash hook | crash hook |
input | tap, drag, scroll, type, keys, Back | touch events and semantics actions; Back through adb | accessibility actions and the text-input responder; Back through Compose's back dispatcher |
fault | network conditions: extra latency, a failure rate, offline, blocked URL patterns | reaktor-io HTTP conditions | the same |
A few rules keep this safe on a phone someone is using:
- Actions that change or remove data on the device, such as clearing app data or uninstalling, go through the workbench's approval step. Taps, typing and scrolling go straight through.
- When network conditions are on, the phone's header in the pane shows a badge. Clicking the badge turns them off. They also end when the app restarts.
- Request headers that look like secrets, and secret-looking values in bodies and logs, are masked in the agent before they leave the phone.
- The agent must never take the app down. A failure inside it, such as the desktop's connection dropping mid-message, is written to the app's log as a warning and the agent carries on.
- The agent keeps listening. If its socket stops working, it opens a new one. On iOS it also opens a new one each time the app comes back to the foreground, because iOS can take a listening socket away from a suspended app.
- The screen is read without racing the app. On iOS the agent records the frame's drawing commands on the main thread, which is cheap, and turns them into pixels on a background thread.
The desktop half lives in bestbuds/modules/engine/.../workbench/devices: DevToolsState finds
devices and holds the selection, one DeviceLink per phone holds that phone's data, and each tab is
one file.
2. The pane, tab by tab
Screens
- Inspect highlights the element under the pointer and selects it on click. When two phones are shown, the matching element on the other phone gets a dashed outline.
- Interact sends taps, drags, scrolls and typing to the real app. Back and Home are in each phone's header.
- Outlines draws every element's bounds. Mirror taps repeats a tap on the matching element of the other phone.
- Record turns what you do in Interact mode into a Maestro flow you can copy or save.
- A small readout on each screen shows the share of slow frames in the last ten seconds and the memory in use.
Elements
- The tree comes from the phone itself: Compose semantics on Android, the UIKit accessibility tree
on iOS. Elements with a
testTagcarry the same id on both. - Parity counts how many elements match on the other phone and lists the ones found on only one. Only differences hides the rest.
- Accessibility issues marks tappable elements with no label, touch targets under 48 dp (Android) or 44 pt (iOS), and repeated test tags.
- The details panel can tap, focus, set text or copy a Maestro step for the selected element.
Network
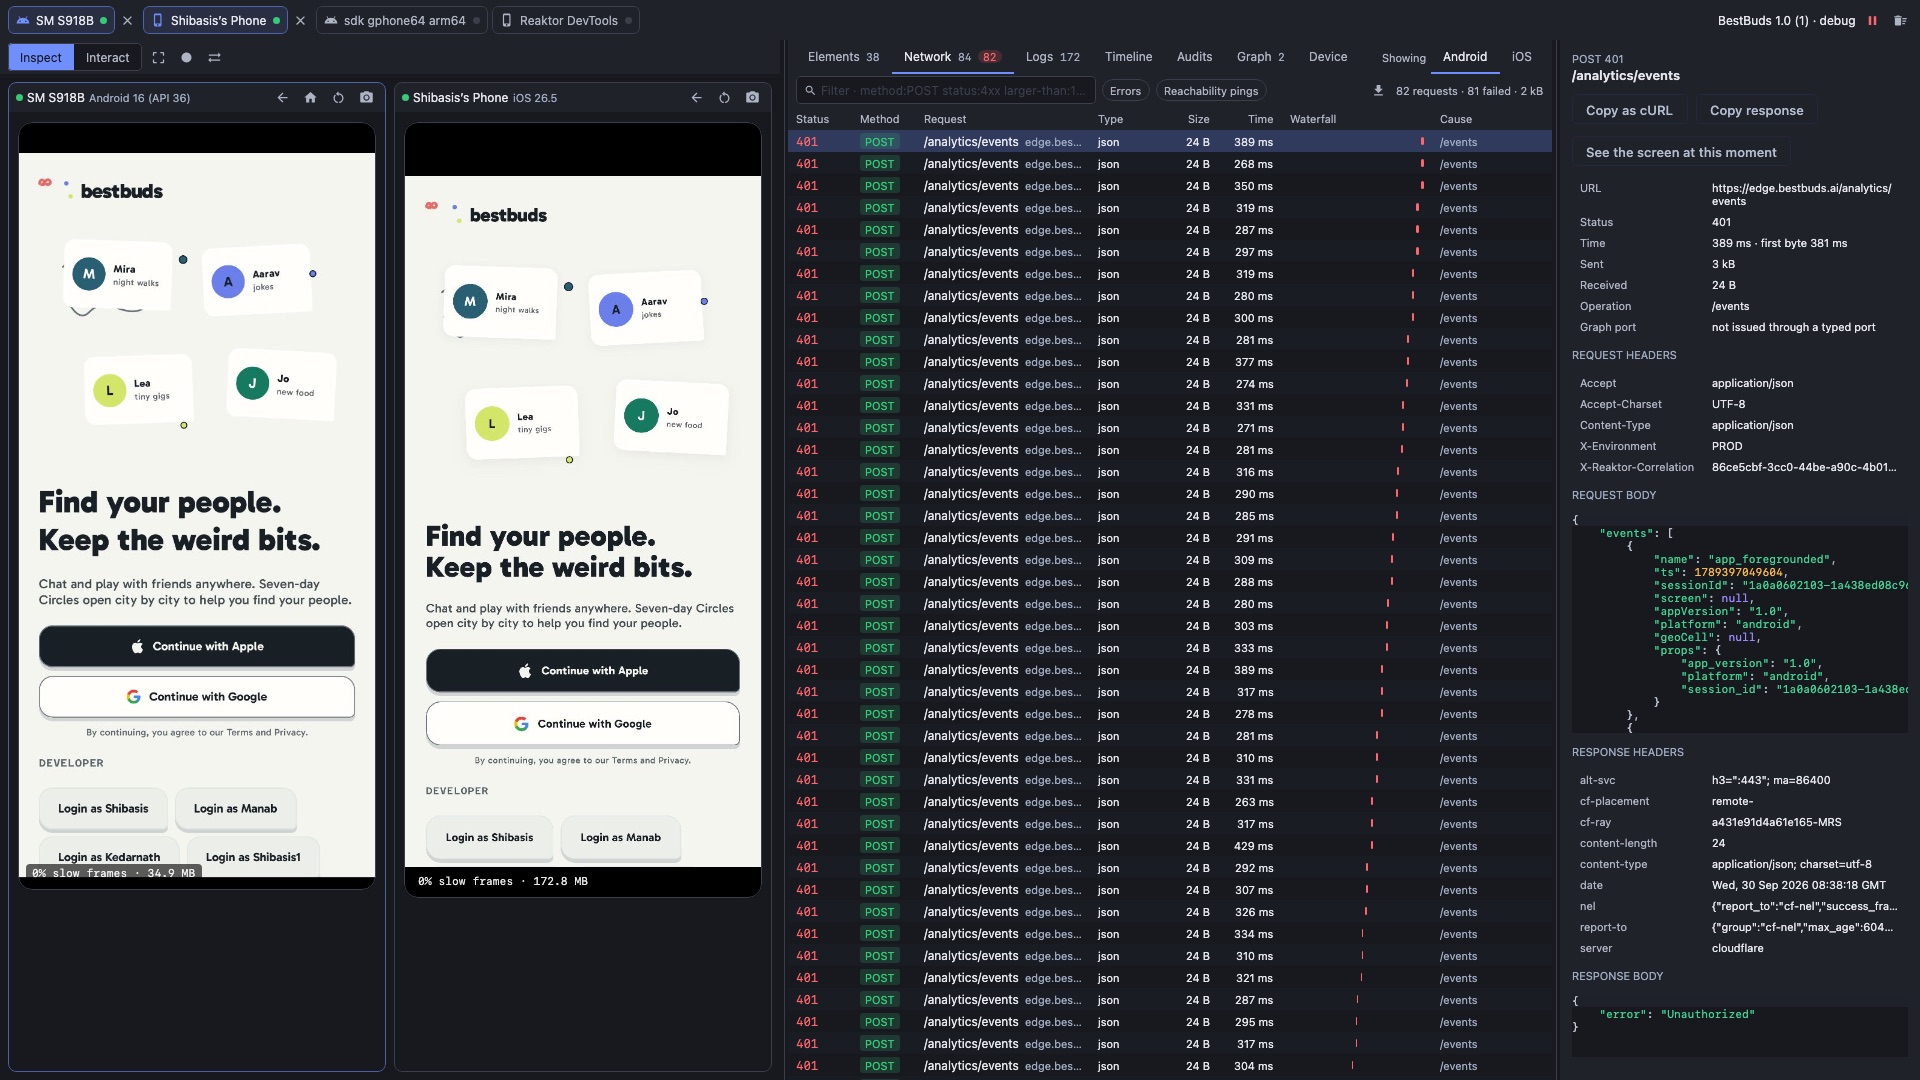
- One row per request: status, method, path and host, type, size, time, a waterfall, and the graph port that caused it when the call went through a typed port.
- The details panel shows headers, pretty-printed bodies, Copy as cURL, and See the screen at this moment, which jumps the phone mirror to when the request started.
- The download button saves the visible requests as a HAR file, which Chrome DevTools and Charles can open.
- Block requests like this in a row's menu makes the app's matching requests fail until you unblock them in the Device tab.
- Sockets, the switch above the table, lists the app's WebSocket connections: status, URL, messages sent and received, bytes, and how long each was open. Selecting one shows its messages in order, each with its direction, time since the connection opened and size, and JSON pretty-printed. Heartbeat pings and pongs are hidden unless you ask for them.
- A socket that failed to open, or closed with a code other than 1000 (normal closure), is marked red. It also gets a mark on the Timeline's Sockets lane and counts against the Network audit.
The filter box takes a small query language, copied from Logcat and Chrome:
| Query | Matches |
|---|---|
analytics | text anywhere in the method, URL, status or operation |
-analytics | leaves those out |
~^/v2/ | a regular expression |
method:POST · status:401 · status:4xx · status:failed | method and status |
host:edge · path:/circles · cause:userRepository | parts of the request, and the port that made it |
is:failed · is:slow | failed, or over one second |
age:30s · larger-than:100k · slower-than:2s | time since, response size, duration |
Logs take tag:, message:, level:warn (that level and above), is:error, is:crash,
is:app, is:system and age: in the same way.
Timeline and replay
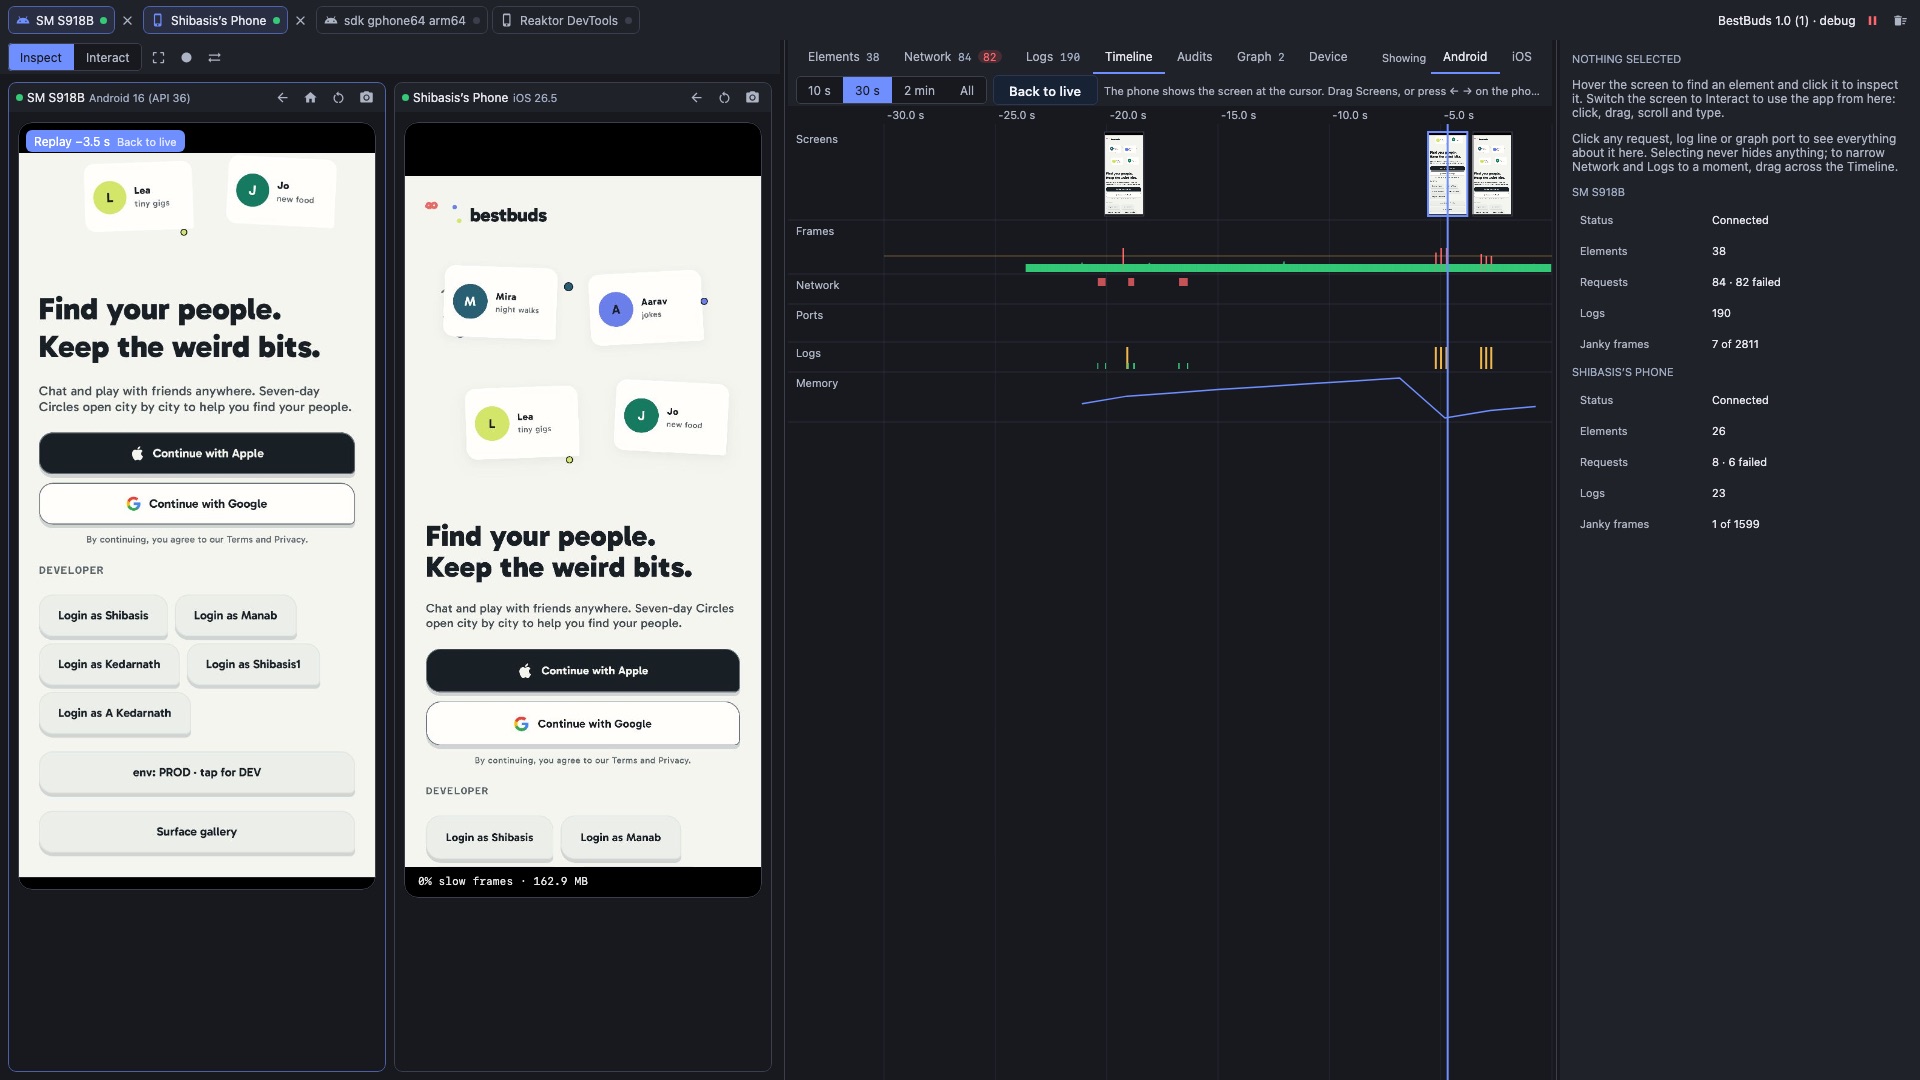
- One clock for frames, network requests, graph port calls, logs and memory, over the last 10 seconds, 30 seconds, 2 minutes or the whole session.
- Screens is a filmstrip of what the phone showed. Click it, or drag along it, and the phone's mirror shows that moment with the UI tree from that moment. Elements and the details panel follow. The arrow keys step one frame; Escape or Back to live returns.
- Dragging across the other lanes narrows Network and Logs to that stretch of time.
- Clicking a request, a port call or a log line in a lane selects it.
The pane keeps up to 240 screens per phone, one every 400 ms at most, so about the last two minutes of activity, and only while the pane is connected.
Audits
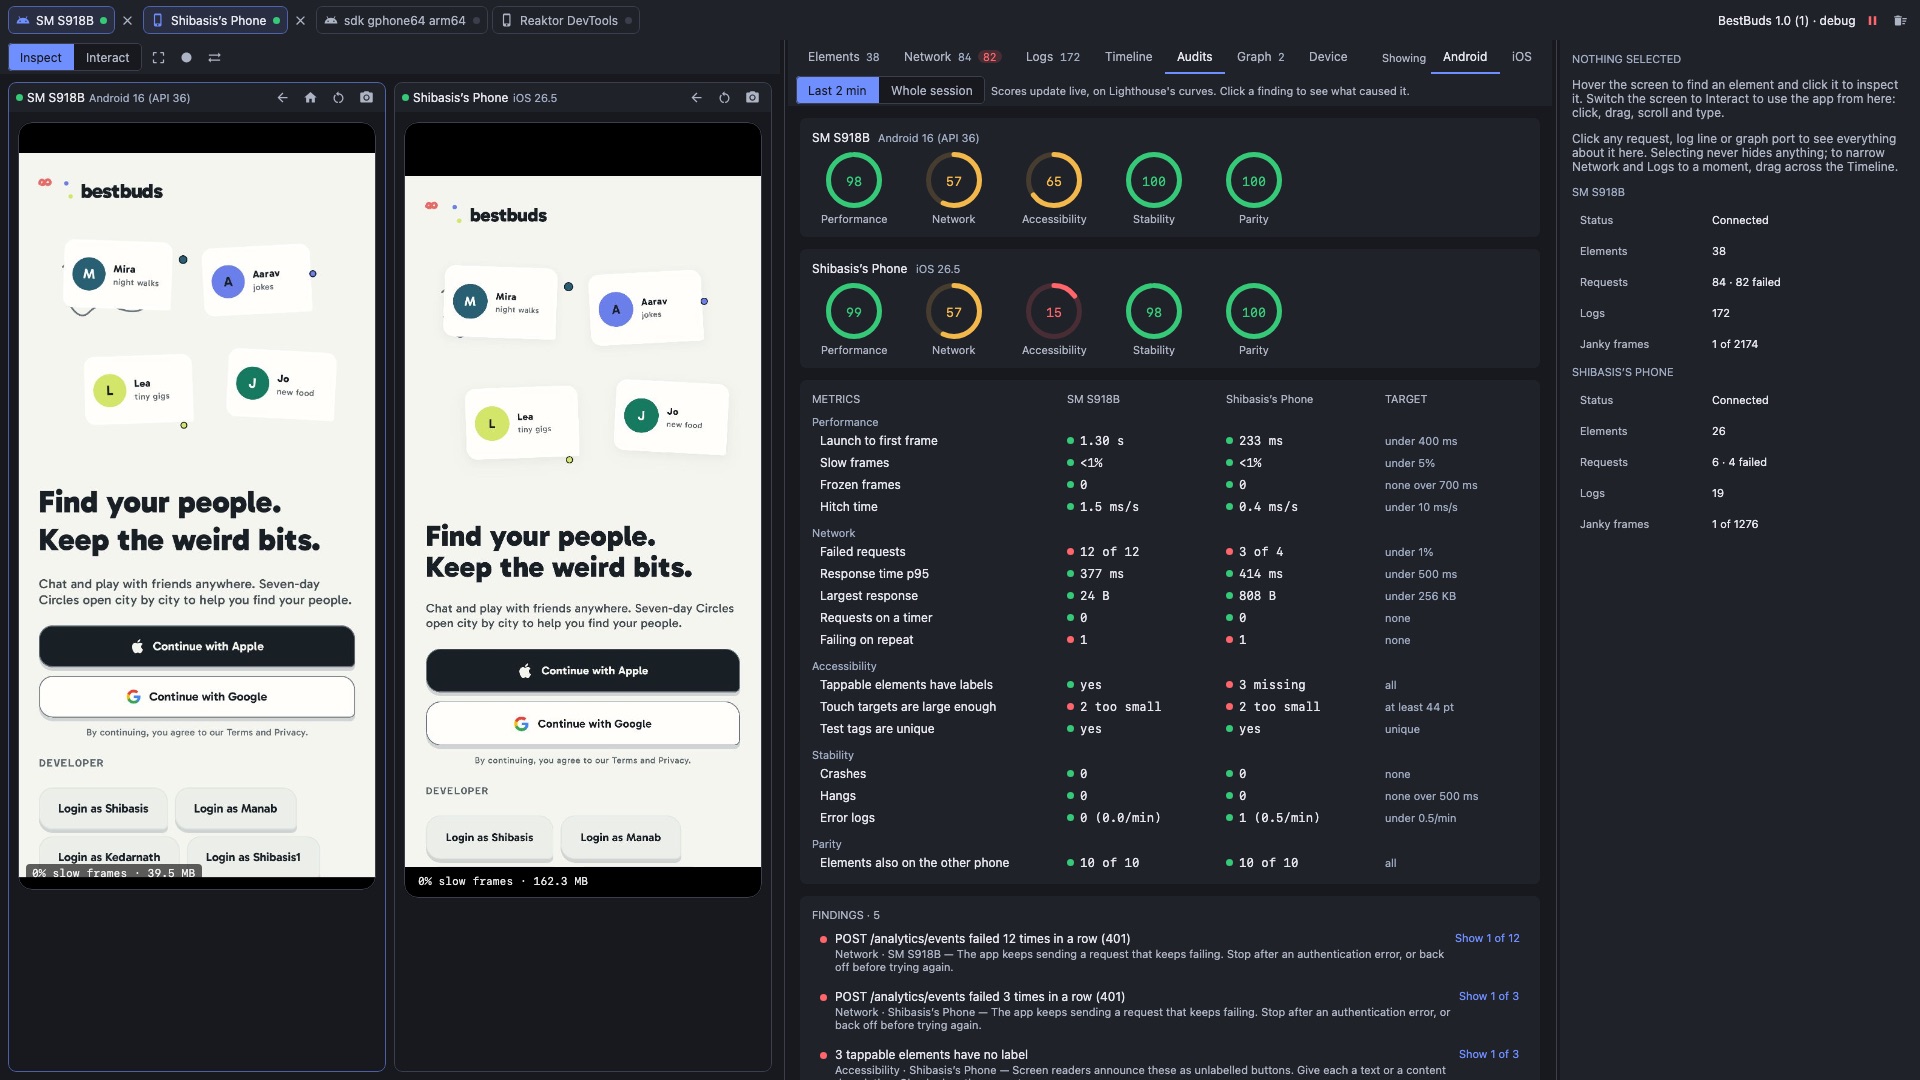
- A score from 0 to 100 per category and per phone: Performance, Network, Accessibility, Stability, and Parity when two phones are shown. Section 3 explains the scoring.
- The metrics table puts both phones next to each other with the target for each metric.
- Findings are sorted by how serious they are. Clicking one selects the request, log line or element behind it and opens the right tab; clicking again steps to the next piece of evidence.
- The scores cover the last two minutes or the whole session, and update every two seconds.
Graph
- The app's graph nodes and their ports, with calls, failures, median and worst latency, and a sparkline per port. Selecting a port can reveal its node in the workbench's Graph mode.
Device
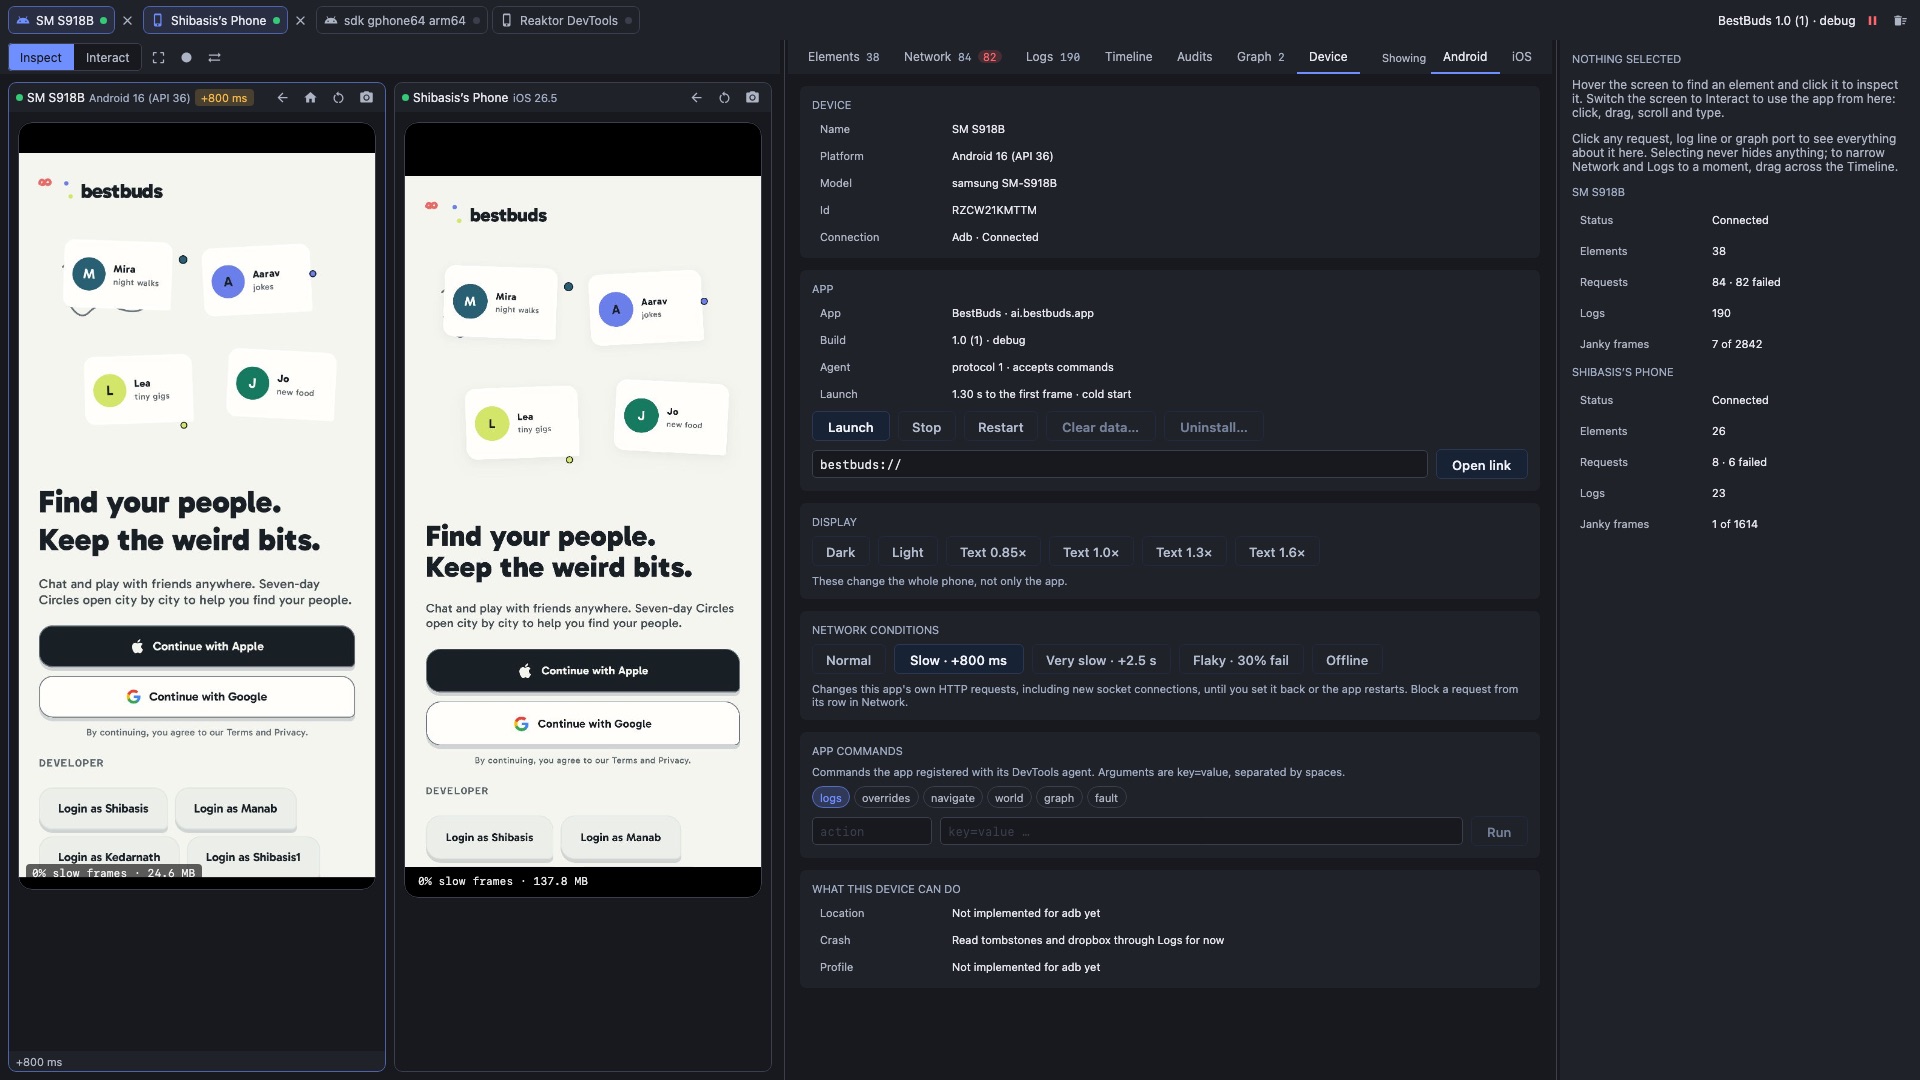
- The device and the app: model, OS, connection, build, and Launch, the time from process start to the first drawn frame on the last cold start.
- Launch, Stop and Restart. Clear data and Uninstall go through approval.
- Open a deep link.
- Dark mode and text size on Android. These change the whole phone.
- Network conditions: Normal, Slow (+800 ms), Very slow (+2.5 s), Flaky (30% of requests fail) and Offline, plus the list of blocked patterns. They change the app's own HTTP requests, including new socket connections.
- App commands: anything the app registered with its agent, such as log level, overrides and navigation.
- Crashes, with their stack traces in the details panel.
The Desktop preview chip in the device bar opens the in-process preview and graph inspection workspace built on 13 September, for apps running inside the desktop JVM.
Saved sessions
- Save in a phone's header writes everything the pane holds for that phone to a
.reaktortracefile on the Desktop: screens and UI trees, requests, sockets, logs, graph port calls, frames, memory, crashes, the launch time and the network conditions. - Open a saved session (the folder button in the device bar) adds the recording as a phone of its own, marked Saved. Every tab works on it with the clock stopped at the moment it was saved, including replay, audits, filters and HAR export.
- A session opened while one phone is shown appears next to it, so a live phone can be compared with a recording, or an Android run with an iPhone run from earlier.
- A saved session refuses taps, Back and other commands, because there is no app behind it.
- The file is a zip:
manifest.json(formatreaktortrace/1, the device, the app build, launch time and network conditions),data.json(everything else) andscreens/NNNN.jpg.
For coding agents
Reaktor Desktop's MCP server (127.0.0.1:8765) carries seven DevTools tools. They read what the
pane has captured. If the DevTools mode has not been opened in that window, the first read starts
device discovery and attaches to the connected phones.
| Tool | Returns |
|---|---|
devtools_devices | the phones and saved sessions, with the app, its build, launch time, counts of requests, sockets and logs, and any network conditions |
devtools_audit | scores, metrics and findings with their evidence, for the last two minutes or the whole session |
devtools_requests | requests newest first, filtered with the same query language as the Network tab |
devtools_request | one request in full: headers, bodies up to 16 KiB with secrets masked, and a cURL command |
devtools_logs | log lines, filtered with the Logs query language |
devtools_elements | the elements on screen now, with bounds, actions and accessibility issues |
devtools_sockets | WebSocket connections, and one connection's messages |
A phone is named by its device key, part of its name, android or ios. The tools only read;
driving a phone stays in the pane.
3. How the audit scores work
Each metric is scored on the same curve Lighthouse uses. A metric has two control points: a good value that scores 90 and a median value that scores 50. Between and beyond them the score follows a log-normal curve, so improving a bad value moves the score a lot and polishing a good one moves it a little. Pass/fail checks score 100 or 0. A category's score is the weighted average of its metrics. Rings are green from 90, orange from 50 and red below.
| Category | Metric | Good (90) | Median (50) | Weight | Where the numbers come from |
|---|---|---|---|---|---|
| Performance | Launch to first frame, Android | 1.5 s | 5 s | 20 | Android vitals calls a cold start of 5 s or more slow |
| Performance | Launch to first frame, iOS | 400 ms | 2 s | 20 | Apple's goal is a first frame within 400 ms |
| Performance | Slow frames (over 1.5× the frame interval) | 5% | 25% | 25 | Android vitals flags sessions with over 50% slow frames |
| Performance | Frozen frames (over 700 ms) | 0.01% | 0.1% | 20 | Android vitals flags over 0.1% frozen |
| Performance | Hitch time, ms late per second | 10 | 25 | 25 | Apple: up to 10 good, up to 25 warning, over 50 critical |
| Performance | Memory growth per minute | 2 MB | 12 MB | 10 | Reaktor's own choice |
| Network | Failed requests | 1% | 10% | 30 | Reaktor's own choice |
| Network | Response time p95 | 500 ms | 1.5 s | 25 | Reaktor's own choice |
| Network | Largest response | 256 KB | 1 MB | 10 | Reaktor's own choice |
| Network | Requests on a timer | none | — | 20 | pass/fail |
| Network | Failing on repeat (3 or more in a row) | none | — | 15 | pass/fail |
| Accessibility | Tappable elements have labels | all | — | 10 | pass/fail; weights follow Lighthouse's critical, serious and moderate |
| Accessibility | Touch targets are large enough | all | — | 7 | 48 dp on Android, 44 pt on iOS |
| Accessibility | Test tags are unique | all | — | 3 | pass/fail |
| Stability | Crashes | none | — | 10 | pass/fail |
| Stability | Hangs | none | — | 5 | Android 5 s (an ANR), iOS 500 ms (Apple's hang) |
| Stability | Error log lines per minute | 0.5 | 5 | 5 | Reaktor's own choice |
| Parity | Elements missing on the other phone | 5% | 30% | 10 | Reaktor's own choice |
The findings that go with the scores:
- Performance: slow launch, a high share of slow frames, frozen frames, frames running late, memory growing steadily.
- Network: the same endpoint called on a steady timer, an endpoint failing again and again, requests over a second, responses over 512 KB, the same request sent twice within 300 ms.
- Accessibility: unlabelled controls, small targets, repeated test tags. These check the screen shown now, the way Lighthouse checks one page.
- Stability: each crash, hangs, and a burst of error log lines.
- Parity: elements on one phone with no match on the other. This only means something when both phones are on the same screen.
The curve and its clamps are Lighthouse's own: the score is (1 − erf(x)) / 2 with
x = ln(value / median) × 0.906 / ln(median / good), clamped to 90–100 below the good value, 50–89
up to the median and 0–49 beyond it, with Lighthouse's small bonus above 90.
4. Checked on real phones
On a Galaxy S23 and an iPhone 14 Pro running a BestBuds debug build, 30 September 2026:
- Both phones mirrored live together: 74 UI nodes on the Galaxy and 43 on the iPhone, with the same test tags on both.
- From the desktop: taps, scrolling and typing on both phones; set text by element id on the iPhone; Back on the Galaxy and in the iPhone's dialogs.
- Launch to first frame: 1.30 s on the Galaxy, about 0.2–0.3 s on the iPhone.
- Offline mode made the app's next analytics requests fail with Offline: set from Reaktor DevTools; Normal restored them. The desktop set +800 ms on the Galaxy and read it back.
- The audit found real problems in BestBuds:
- While signed out,
POST /analytics/eventsfails with 401 again and again: 12 times in a row in two minutes on the Galaxy, and three times in 22 seconds while offline. - The iPhone has three tappable elements with no label.
- The developer sign-in buttons on the Galaxy are 46 dp tall, under the 48 dp minimum.
- While signed out,
- Replay: after a scroll, the Timeline's filmstrip brought back the scrolled screen on the Galaxy's mirror while the iPhone stayed live.
- The pane's render test runs against both phones and saves every tab, replay and network conditions as images, with no Compose runtime errors. The routing, inspection, shell and every-pane tests pass.
A third pass the same day found three agent bugs on the iPhone and fixed them:
- After the app went to the background and came back, the agent stopped accepting the desktop. It now listens again with a backoff, and re-binds when the app returns to the foreground.
- Reading the screen off the main thread crashed the app. The frame is now recorded on the main thread and turned into pixels off it.
- An error inside the agent could stop it. It is now logged and the agent carries on.
Two tests cover the first and third: the listener dies and comes back, and a failure inside the agent is logged instead of thrown. Back on iOS now uses Compose's own back handling; a Maestro flow swipes back from the screen edge on an iOS 26.5 simulator and passes. Back on Android now goes through the activity's back dispatcher; that is built but not yet tried on the Galaxy.
5. Known limits
- A locked iPhone. iOS pauses the app while the phone is locked, so its agent stops answering. The pane asks you to unlock the phone and connects again once the app is back in front.
- Replay covers screens and UI trees only, for about the last two minutes. Graph state at the playhead is not recorded yet.
- Launch time is time to the first frame. Time until the screen is fully drawn needs the app to say when it is ready.
- Sockets show text messages up to 16 KiB. Binary messages show only their size.
- One iOS simulator at a time. Every simulator shares the Mac's loopback. When two simulators run an app with the agent, only the first agent gets port 47821, and the pane shows that app for both simulators.
- Hitch time counts every frame, including idle ones. Apple measures it during scrolling and animation, so an idle app reads better here than it would in Xcode.
- No profiler yet. There is no CPU sampling or heap analysis.
- Accessibility checks labels, sizes and tags. It does not check contrast, clipped text or large text sizes yet.
6. How it compares
The comparison covered Chrome DevTools and Lighthouse; Android Studio, Xcode and Instruments; VS Code; Flutter and React Native DevTools; Unreal Engine's Insights, Rewind Debugger, Visual Logger and Gameplay Debugger; and measure.sh, with Perfetto, Macrobenchmark, Flashlight and Sentry for performance numbers.
| Capability | Who does it best | Reaktor today |
|---|---|---|
| Live mirror of a real phone with inspection on top | Android Studio's Running Devices with Layout Inspector; Xcode 27 Device Hub | Yes, Android and iPhone side by side |
| The running app's UI tree | Chrome Elements; Layout Inspector; Xcode View Debugger; Flutter Inspector | Yes. No 3D view yet |
| Both platforms compared element by element | none of them | Yes: matches, "only here", the counterpart outline |
| Network capture with bodies | Chrome Network; Studio Network Inspector; Instruments HTTP Traffic | Yes, HTTP and WebSocket. The issuing port is shown when known |
| Network throttling, offline and blocking | Chrome network and request conditions | Yes, from inside the app, with no proxy |
| A filter language | Logcat queries; Chrome filters | Yes |
| HAR files | Chrome | Export. No import yet |
| Many lanes on one clock | Chrome Performance; Unreal Timing Insights; Perfetto | Yes, with brushing |
| Going back in time | Unreal Rewind Debugger; measure.sh session replay; Chrome's filmstrip | Screens and UI trees. Graph state not yet |
| Scored audits | Lighthouse; Flashlight | Yes, five categories, live |
| Launch time | Macrobenchmark; Xcode Organizer | Time to first frame. Not time to fully drawn |
| Jank, hitches and hangs by the vendors' own rules | Studio janky frames; Instruments; Flutter frame chart | Yes |
| Why something updated | Studio recomposition counts; SwiftUI Cause & Effect; React; Unreal Slate Insights | Not yet |
| Memory profiling | Chrome heap snapshots; Studio heap dumps; Xcode Memory Graph; Unreal Memory Insights | Not yet |
| Recording a flow | Chrome Recorder; Maestro Studio | Records Maestro flows. No replay or measuring yet |
| Saving a session to open later | Unreal .utrace; Chrome traces; Playwright traces | Yes, .reaktortrace, opened next to a live phone |
| An agent driving the tool | Chrome DevTools MCP server | Seven read-only DevTools tools over MCP. No driving yet |
What each tool taught, in one line:
- Chrome: one selection that every panel follows, one time axis that filters every table, and a saved file that reopens with its links intact.
- Lighthouse: score each metric on a curve between a good and a median value, and link every finding to the node or request behind it.
- Android Studio and Xcode: inspect on top of the live phone, and judge performance by the platform's own definitions of slow, frozen, hitch and hang.
- VS Code: a debug protocol with capabilities agreed at the start, and logpoints that log without stopping the program.
- Flutter and React Native: tap on the device to select, per-frame bars coloured by the part that missed its deadline, and "why did this render".
- Unreal: record everything cheaply on one clock, then scrub it; overlays per object on the running game; saved sessions you can compare.
- measure.sh: a session timeline that plays back the screen, launch times split into cold, warm and hot, and endpoints grouped into patterns.
7. Roadmap
Ordered by how much each area adds. ✅ done, ⬜ still to do.
1. Cause and effect. Only Reaktor can do this, because it owns the graph.
- ⬜ Link each tap to the port it fired, the requests that followed, the state it changed, the recomposition and the frame.
- ⬜ Show which port issued every request.
- ⬜ Count recompositions per element and say which input changed.
2. Time.
- ✅ Replay screens and UI trees from the Timeline, and jump there from a request or a log line.
- ⬜ Record graph state changes so the playhead shows port values as well.
- ⬜ Bookmarks and named regions, placed from code or from the pane.
- ✅ Save a session to a
.reaktortracefile, open it later without the phone, and compare it with a live phone or another session.
3. Performance.
- ✅ Launch to first frame; slow, frozen and late frames; hangs; the on-screen readout.
- ⬜ Time to fully drawn, from a graph "ready" port so both platforms measure the same moment.
- ⬜ Tag each frame with the screen and graph node on top, so findings can say where.
- ⬜ Export a session to Perfetto for deep Android traces.
4. Network.
- ✅ Capture with bodies, HAR export, network conditions, blocking, the query language.
- ✅ WebSocket connections and messages, which BestBuds uses for chat and circles.
- ⬜ Rules that rewrite a response's status, headers or body.
- ⬜ Resend a request, with or without edits.
5. Audits.
- ✅ Live scores and linked findings for five categories.
- ⬜ Run a recorded Maestro flow several times on both phones and score the run, as Lighthouse user flows and Flashlight do.
- ⬜ Contrast, clipped text and large-text checks.
- ⬜ Flag a regression against the previous run.
6. Memory.
- ⬜ Heap dumps on Android, analysed on the desktop. iOS stays unavailable.
7. Agents.
- ✅ Give coding agents the same reads through MCP: devices, audits, requests, logs, elements and sockets.
- ⬜ The screen image over MCP, and driving the phone (tap, type, Back) through the workbench's approval step.
8. Platform gaps.
- ✅ Back on iPhone graph screens: reaktor-graph now uses Compose's back handling, with the interactive edge swipe.
- ⬜ Long press on iOS.
- ⬜ A command menu for every action in the pane.
8. Design direction
The earlier version of this page, from 13 September 2026, designed DevTools as the place to ask what produces this pixel, what did it do, and what breaks if I change it. Its rules still hold for the next steps. The full text is in the page's git history.
- One selection travels. Every panel reads and writes one selected subject: an element, graph
node, port, connection, route, request or log line. The workbench keeps it in
WorkbenchInspectionSessionin the kernel, so the shell and the MCP host read the same thing. Answers that arrive after the selection has changed are dropped. - From an element to the graph. An element names the control it is, through
Modifier.reaktorElement, and a binding says which graph node, handler and port own it. Finding a binding does not prove the handler ran. Several possible owners are shown as ambiguous and never picked at random. - Routes, drawn pin to pin. A control starts one or more routes through the graph. The useful view draws a chosen route end to end through folded scopes, with returns, errors and retries in their own colour, and marks what the graph cannot see.
- The reverse direction. From a state or service change, show the UI it affects. Showing where a component is mounted is simpler than working out everything a change affects, and the two are labelled differently.
The investigation model
DevTools is organised around one investigation: what is selected, where it runs (which phone or server), when (live, a moment, or a range), and what we know about it (declared in code, observed, recorded or unknown). Two selections apply everywhere: the subject, and the time range. Brushing a time range narrows every surface at once; the Timeline's replay is the first part of that.
- Changes to the running app, such as network conditions, overrides or recorder playback, are visible while they are on and can be turned off from where they show.
- A saved session (
.reaktortrace) is a bundle of evidence: screens, trees, requests, logs, graph events and the findings, openable without the app. The first version records and shows; it does not promise to replay the app deterministically. - Agents get the investigation itself: the subject, the time range, the evidence and what is missing.
Sources for the comparison: Chrome DevTools and its MCP server; Lighthouse performance scoring; Android Studio's Layout Inspector, jank detection and Logcat; Android vitals on rendering, launch time and ANRs; Apple on hangs, hitches and launch time; VS Code debugging; Flutter DevTools; React Native DevTools; Unreal Engine's Insights and Rewind Debugger; measure.sh; and Flashlight.